

After avoiding and putting this off for months now, I finally decided to set this up and I must say, I was a bit silly to even fear this. The only reason I didn’t want to get into it was that I felt it was going to be tedious and hard to maintain, but to my surprise, it was extremely easy to install and set up.
I’ll start by explaining what these self-hosting services are:
First of
Prometheus!

What Is Prometheus? Prometheus is an open-source technology designed to provide monitoring and alerting functionality for cloud-native environments, including Kubernetes. It can collect and store metrics as time-series data, recording information with a timestamp.
To have Prometheus collect and scrape all the metrics, we also need to use Node-Exporter service, which is provided by the same developer.
Grafana!

Grafana is an open-source interactive data-visualization platform, developed by Grafana Labs, which allows users to see their data via charts and graphs that are unified into one dashboard (or multiple dashboards!) for easier interpretation and understanding.
I will not get into Kubernetes at this time as that needs an entire post and I’m still not too sure how that even works at this point haha!
Installation –
Now, there are several ways of going about this but I found that the best way, at least for me, was to use docker and deploy all the services in a stack, through Portainer’s UI.
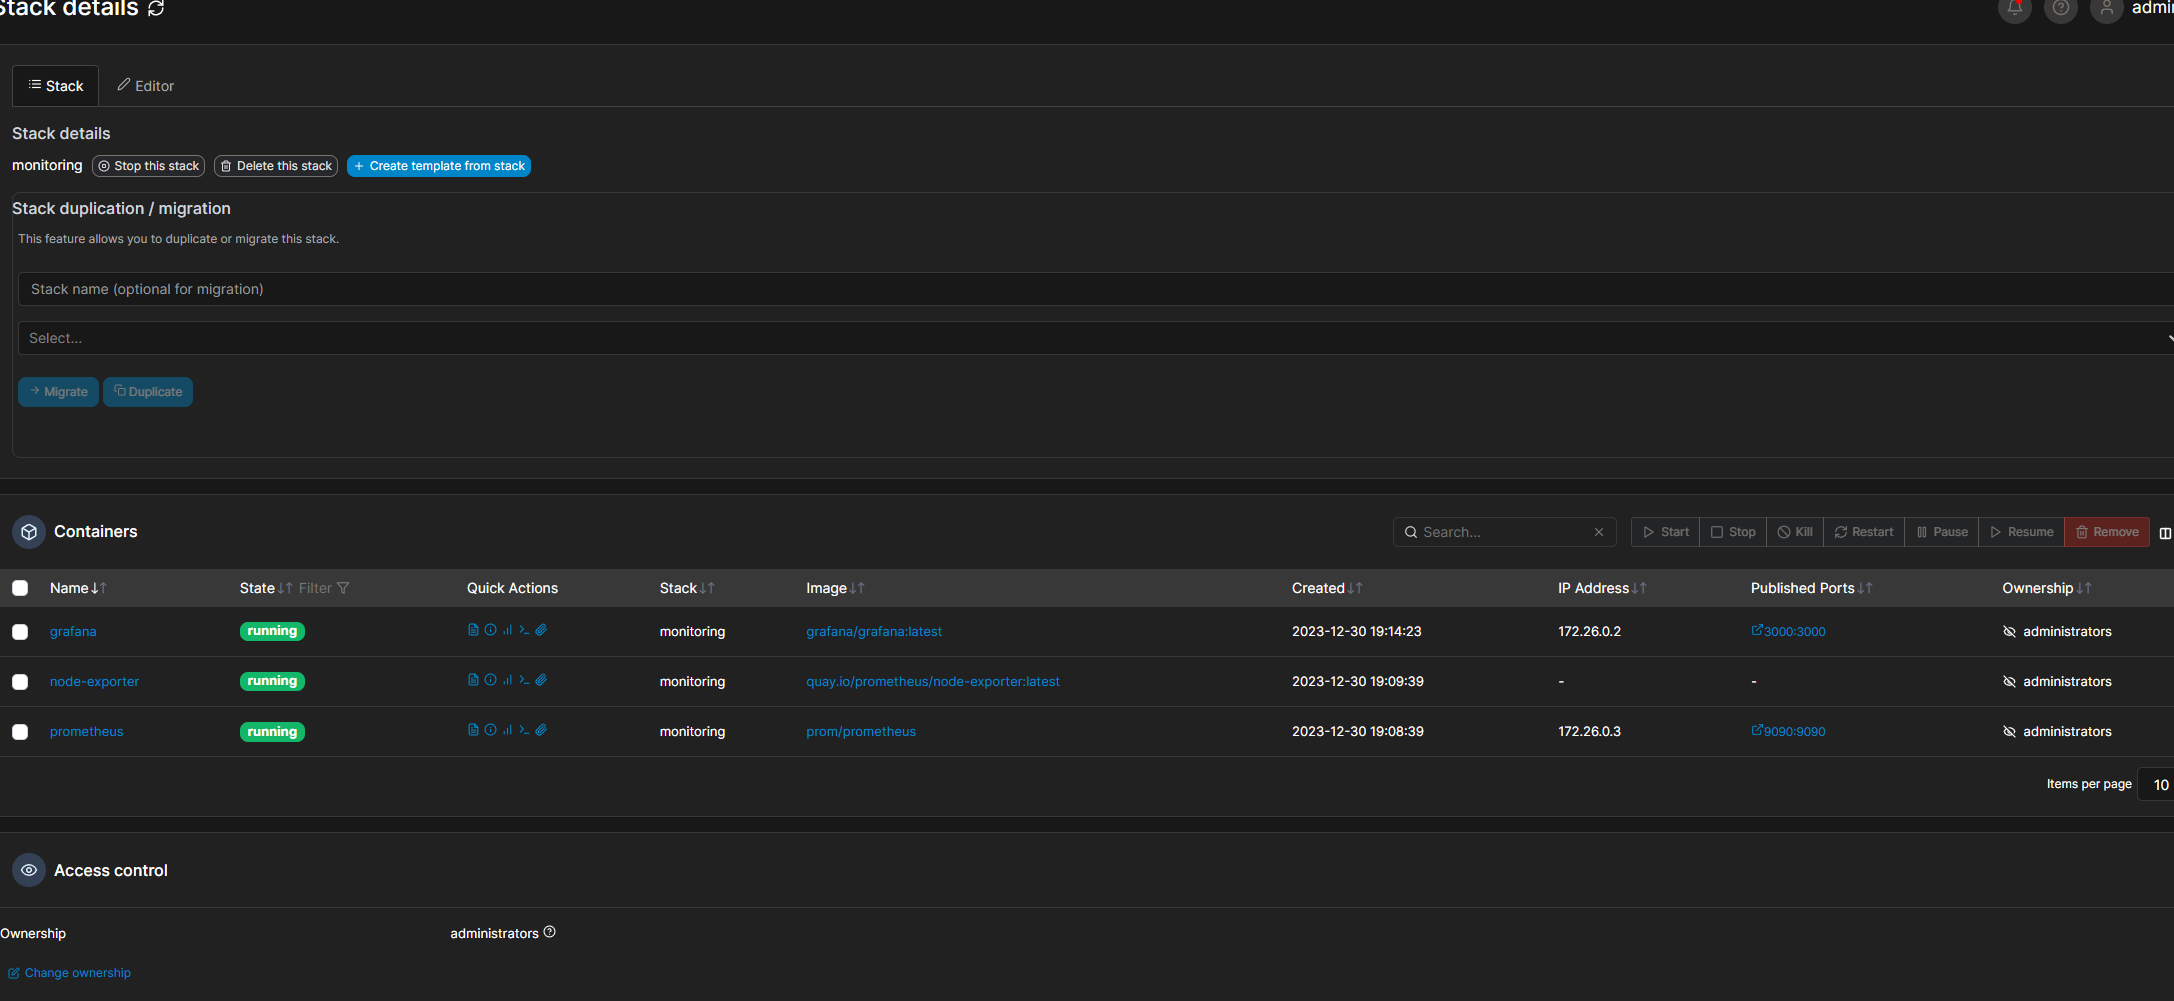
Docker-Compose file for how I’ve done this –
version: '3.3'
services:
    node-exporter:
        network_mode: host
        pid: host
        volumes:
            - '/:/host:ro,rslave'
        image: 'quay.io/prometheus/node-exporter:latest'
    prometheus:
        container_name: prometheus
        ports:
            - '9090:9090' #modify to your setup needs
        volumes:
            - '/home/marius/docker/prometheus/prometheus.yml:/etc/prometheus/prometheus.yml' #modify the path for your install location
        image: prom/prometheus
    grafana:
        container_name: grafana
        ports:
            - '3457:3457' #modify to your setup needs
image: grafana/grafanaMake sure to deploy a node-exporter on each machine that you want to be scraped by Prometheus.
Prometheus will need a yml file to know what nodes to scrape. I will provide my config as an example –
global:
  scrape_interval: 5s
  external_labels:
    monitor: 'node'
scrape_configs:
  - job_name: 'prometheus'
    static_configs:
      - targets: ['192.168.XX.XXX:9090'] ## IP Address of the localhost. Match the port to your container port
  - job_name: 'node-exporter'
    static_configs:
      - targets: ['192.168.XX.XXX:9100'] ## IP Address of the localhost
      - targets: ['192.168.XX.XXX:9100'] ## IP Address of the desired node
      - targets: ['192.168.XX.XXX:9100'] ## IP Address of the desired node
      - targets: ['192.168.XX.XXX:9100'] ## IP Address of the desired node
      - targets: ['192.168.XX.XXX:9100'] ## IP Address of the desired node
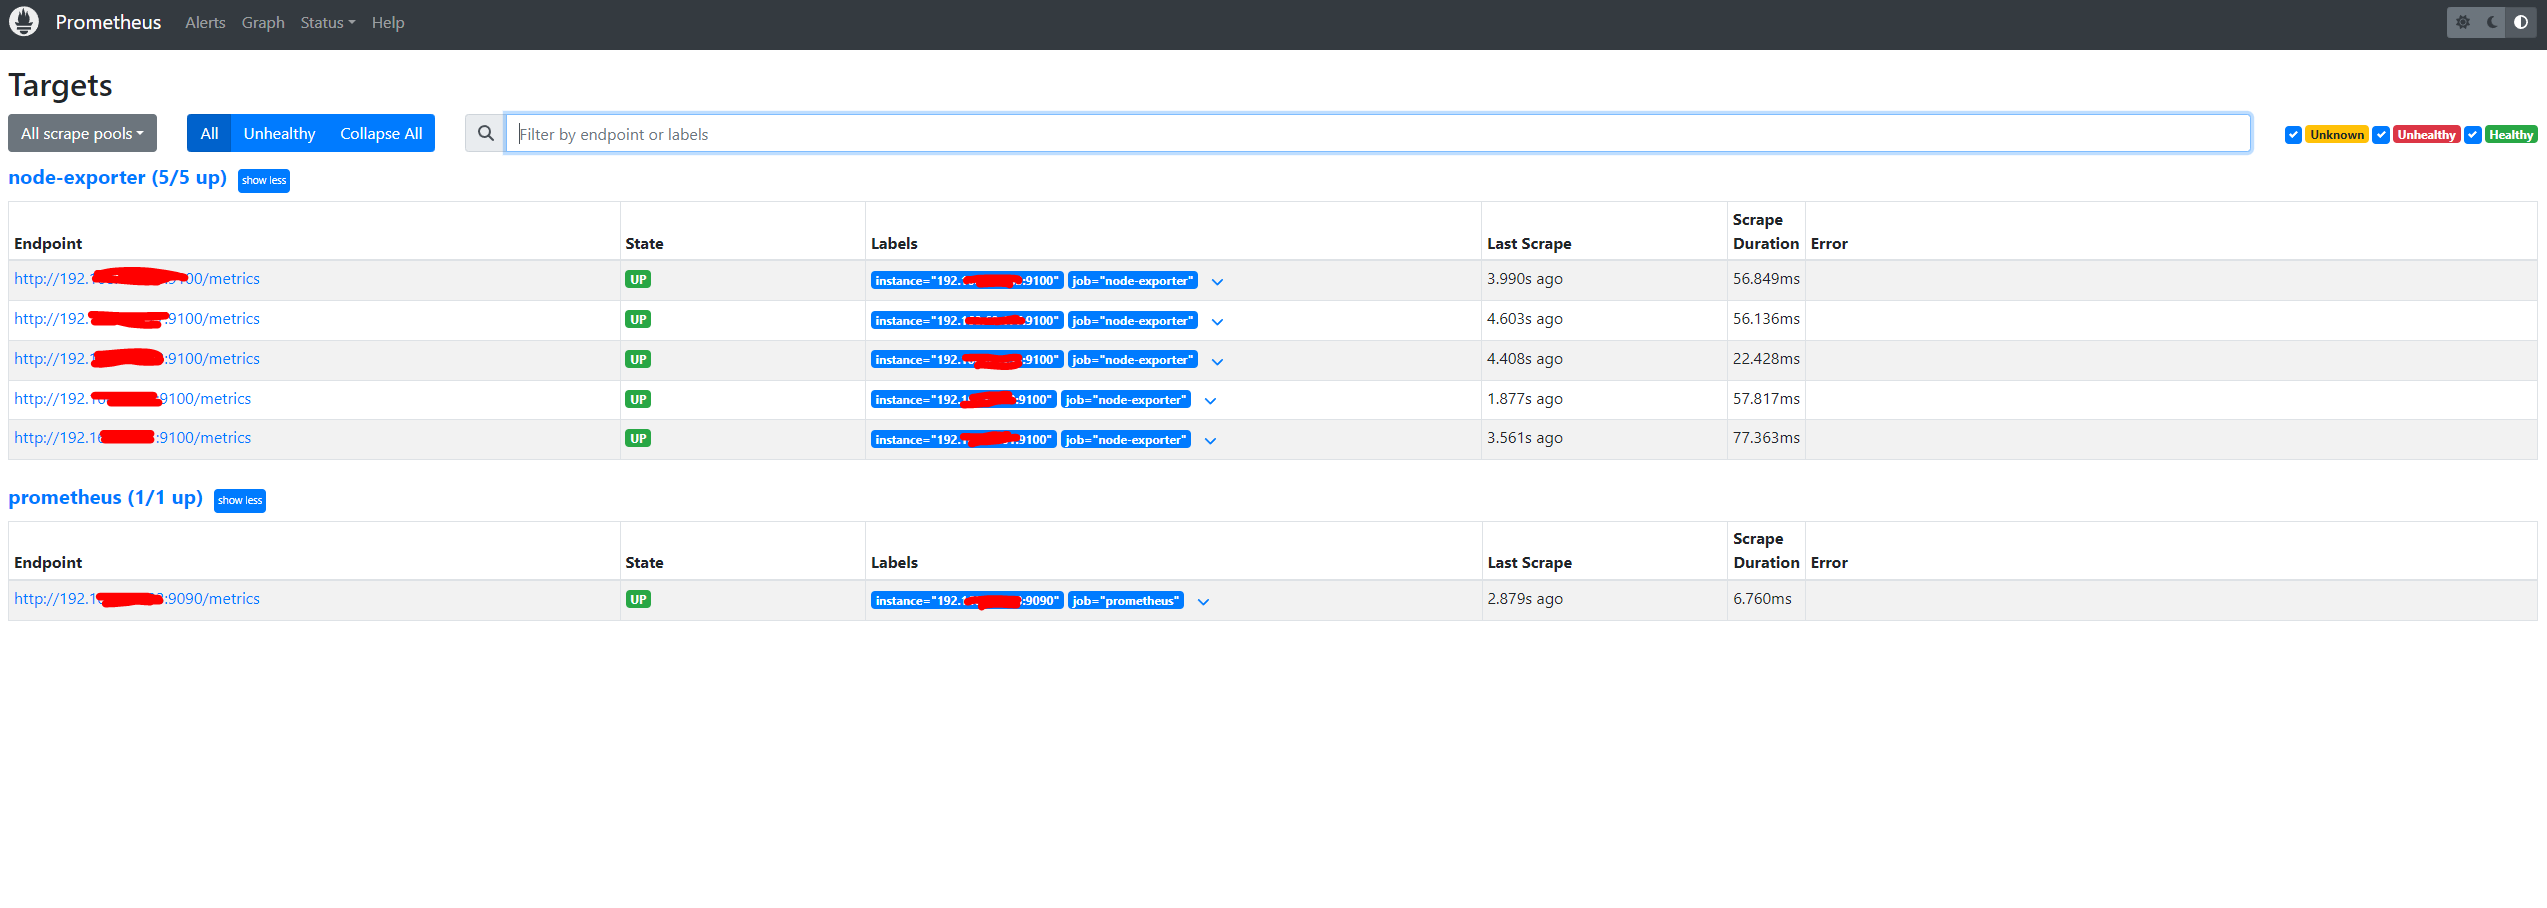
After Prometheus server is started, if everything is set correctly, you should have something like this –
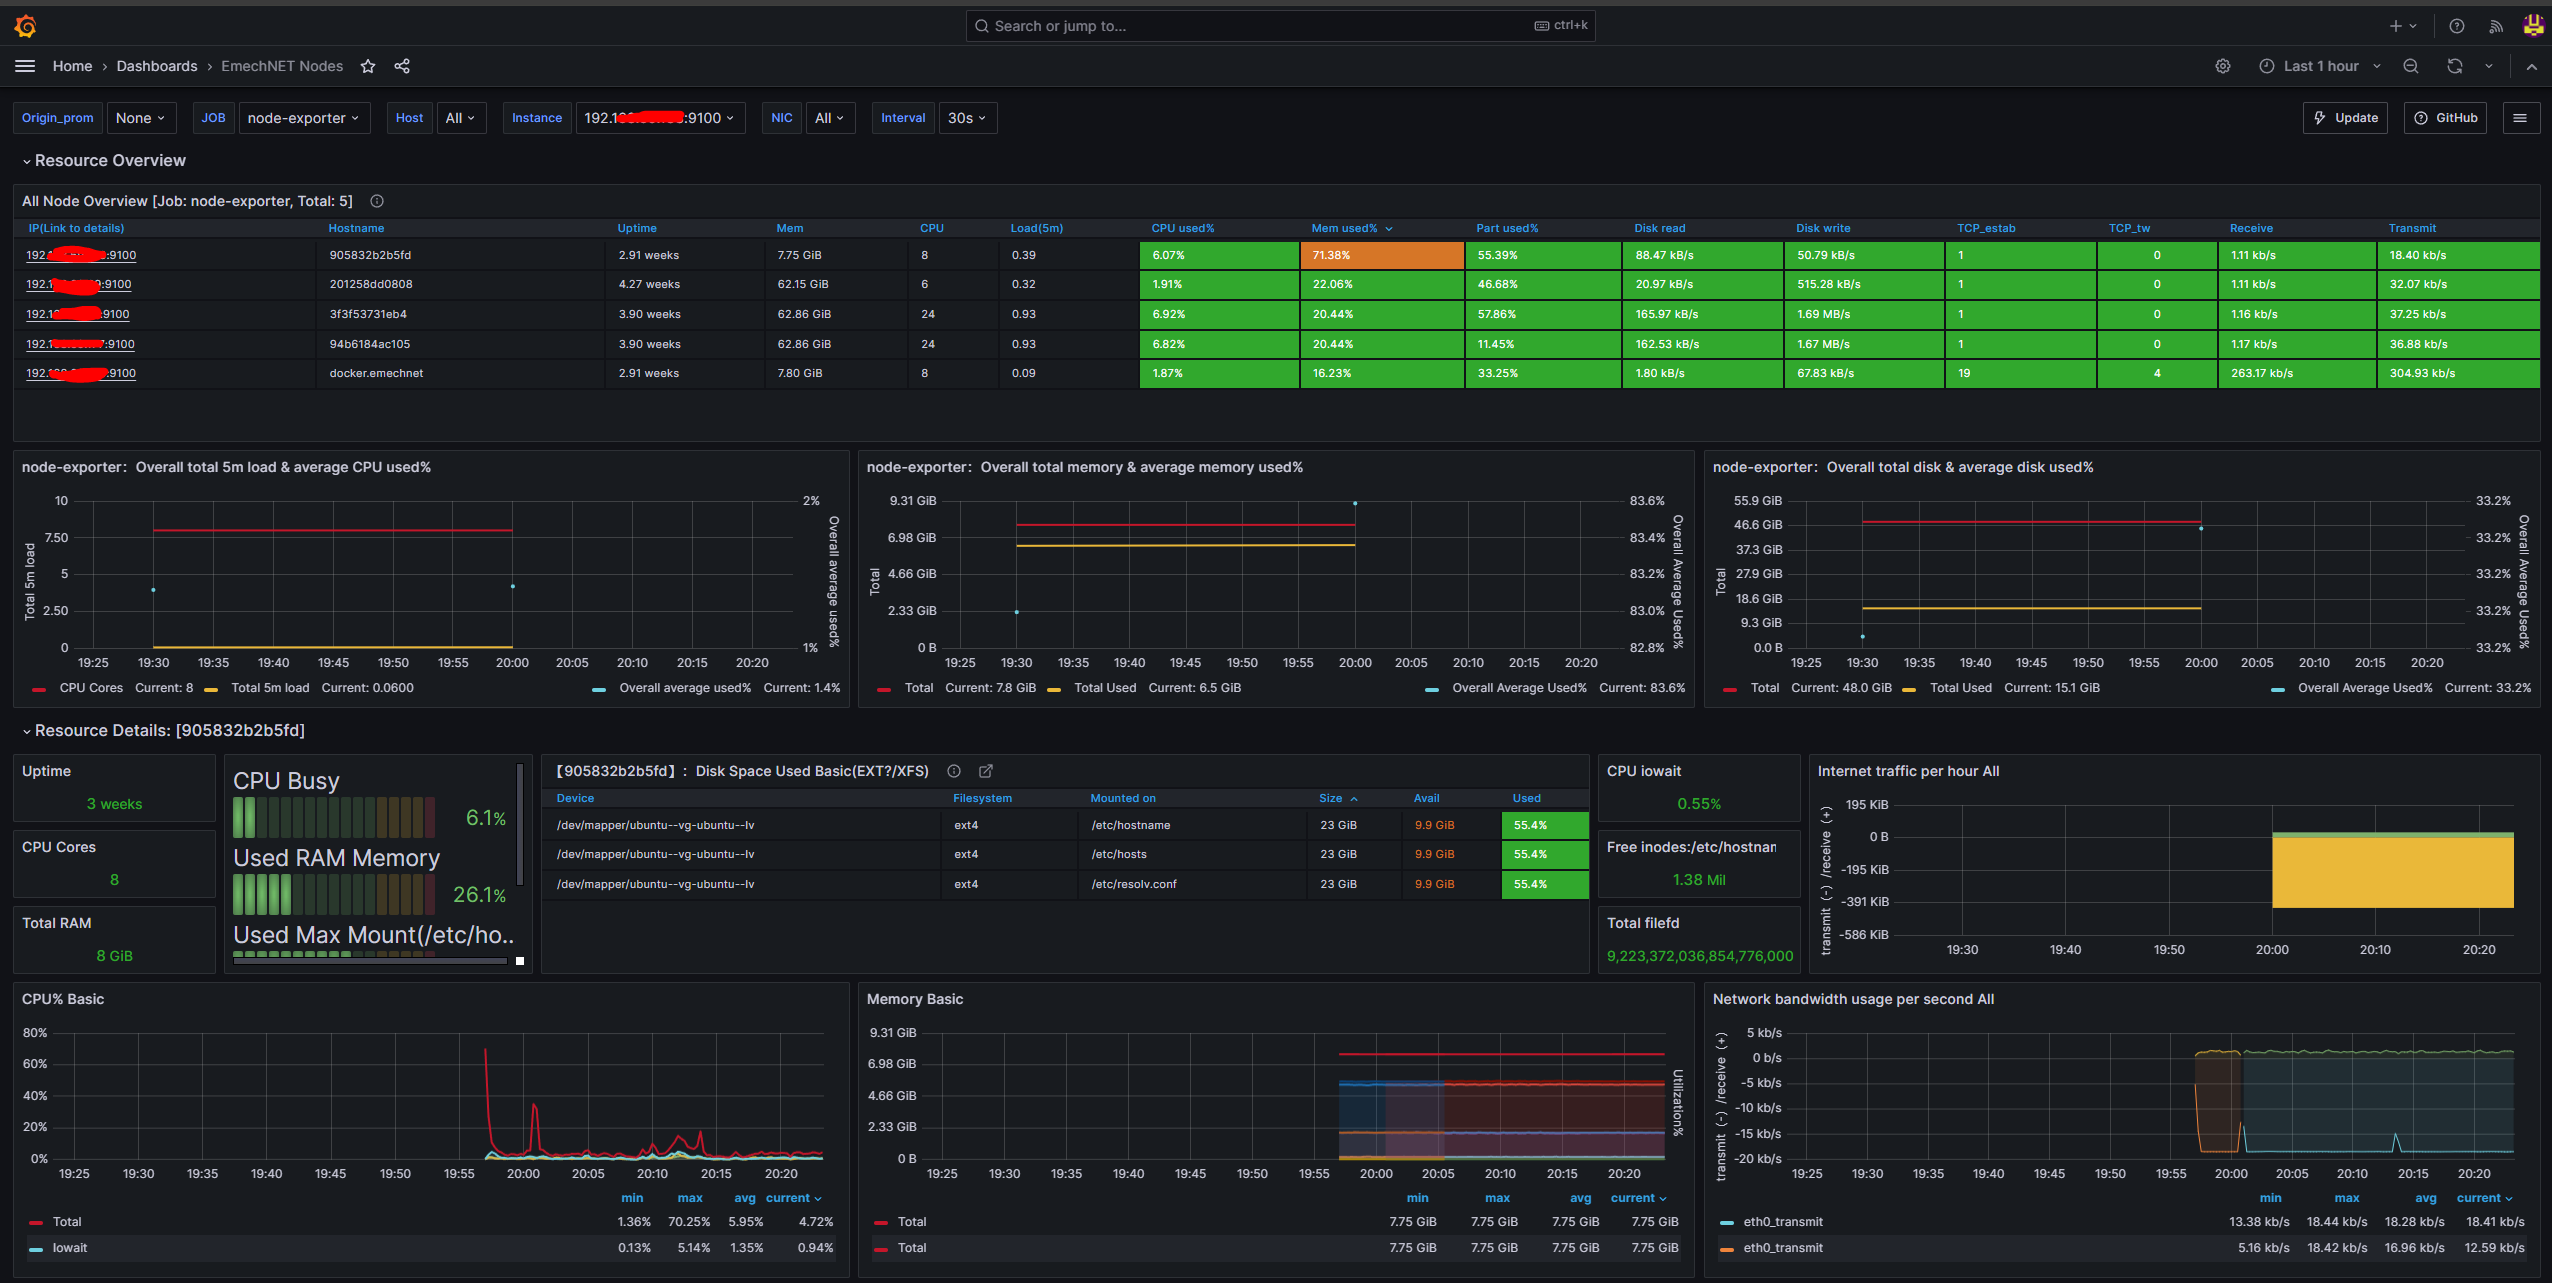
In Grafana, you will need to add your preferred Dashboard and link it to your Prometheus instance.
You can find a multitude of pre-set dashboards on Grafana’s official website. Just copy/paste dashboard id’s into your Grafana setup and you should be good to go.
After Grafana is booted, you should have something like this –
I must say, this has been a godsend. I can see how all my home lab environments are doing and troubleshoot at the click of a button. We get an abundance of information from our system poured into ONE beautiful UI and this is extremely useful for admins in general.
I hope you’ll find this just as useful as I did! See ya!